Uptime Kuma vs Gatus (2026): Which Should You Self-Host?
Uptime Kuma vs Gatus compared on a real VPS: setup with Docker Compose, monitoring features, alerting, status pages, and which self-hosted tool to pick.

30 min read
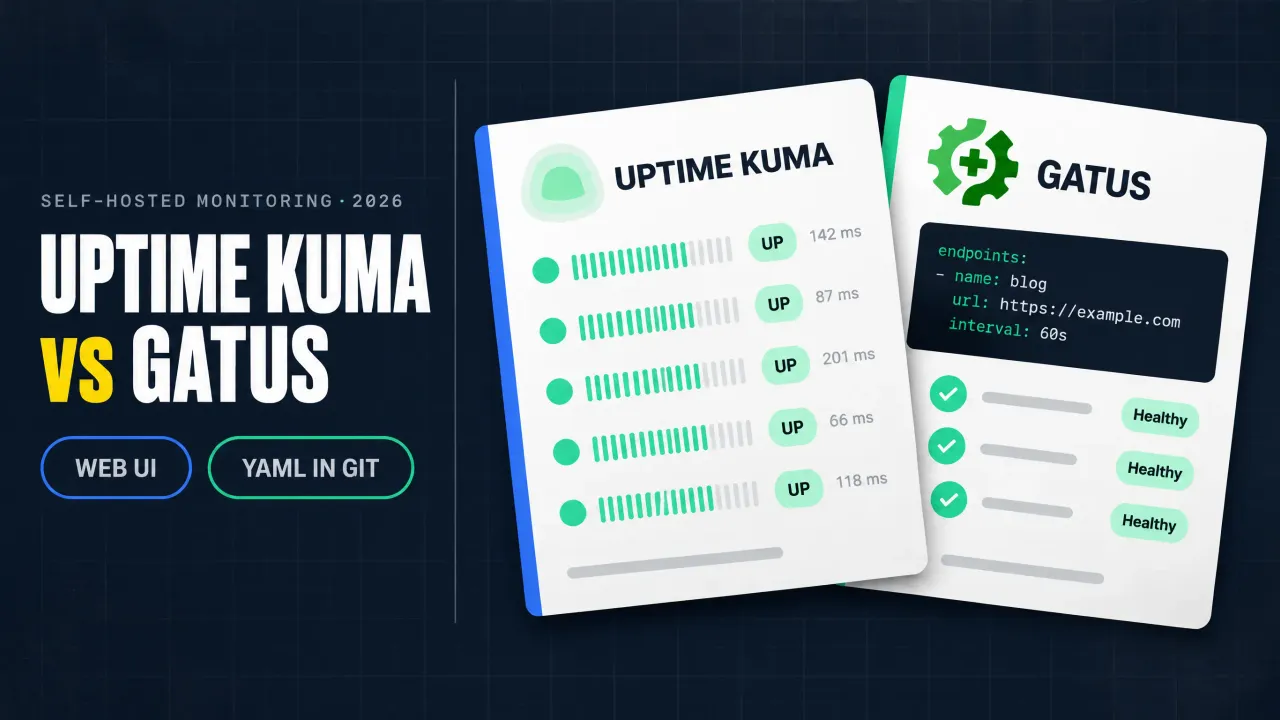
If your VPS runs anything worth waking up for, you need self-hosted uptime monitoring that pages you before your users do. The uptime kuma vs gatus question is the first fork in that road. Both are free, open source, single-container blackbox probers, and both will ping you at 2 a.m. when the blog or the API dies. This comparison uses the 2026-era versions: Uptime Kuma 2.5.3 (August 2026) and Gatus v5.37.0 (September 2026), checked against the upstream projects on 27 September 2026.
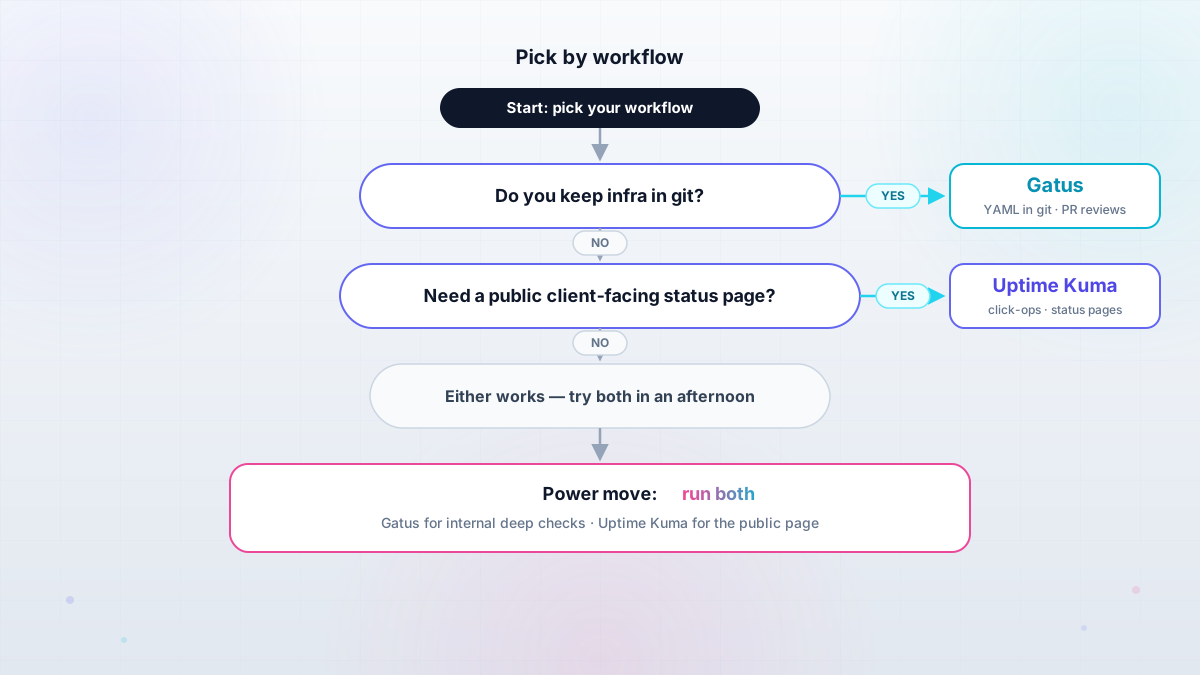
The one-sentence difference: Uptime Kuma is a click-ops monitor with a beautiful status page. Gatus is YAML-defined monitoring for people who keep infrastructure in git. Everything else follows from that.
If you arrived looking for an uptime kuma alternative after watching a SQLite file eat a disk, or after a “gatus vs uptime kuma reddit” thread that ended in “both are fine, pick one”, this is the operator version. Both tools installed with Docker Compose on a small VPS, the same five monitors configured in each, the failure modes nobody covers, and a blunt decision rubric.
The services you run are what the monitor watches. Maybe you are self-hosting Jellyfin on a VPS alongside a Git forge, a couple of side projects, and a nightly backup. If that box already runs a self-hosted PaaS like Coolify, Dokploy or Kamal 2, the monitor slots in beside it on the same Docker network.
Below: the 10-second verdict table, two working installs behind a reverse proxy, side-by-side configs, and what breaks six months in.
Uptime Kuma vs Gatus at a glance
The 10-second answer first. Both tools probe from the outside (the same job UptimeRobot does, minus the SaaS). The real difference is who writes the config and where it lives.
| Uptime Kuma | Gatus | |
|---|---|---|
| Repo | louislam/uptime-kuma |
TwiN/gatus |
| Stars (Sep 2026) | ~91,900 | ~12,200 |
| Runtime | Node.js SPA + Socket.IO | Go, single static binary |
| License | MIT | Apache-2.0 |
| Latest stable | 2.5.3 (Aug 2026) | v5.37.0 (Sep 2026) |
| Config model | Web UI, state in SQLite | YAML file, hot-reloaded on change |
| Storage | SQLite embedded; MariaDB/PostgreSQL in v2 | memory (default), sqlite, postgres |
| Check types | HTTP(s), keyword, JSON query, WebSocket, ping, DNS, push, Steam, Docker, TCP port | HTTP, TCP, UDP, SCTP, ICMP, DNS, WebSocket, gRPC health, SSH, TLS/STARTTLS, domain expiry |
| Assertion depth | keyword / JSON query settings | condition language over status, JSONPath body, response time, cert and domain expiry, DNS rcode |
| Notifications | 90+ providers | ~40 providers |
| Status pages | many, each mappable to its own domain | one per instance; multi-instance aggregation is experimental |
| Auth | users + TOTP 2FA | basic auth (bcrypt) + OIDC |
| Default port | 3001 | 8080 |
| Docker image | louislam/uptime-kuma:2 |
ghcr.io/twin/gatus:stable |
Quick pick:
- Pick Gatus if your infrastructure lives in git and you want monitor changes reviewed as pull requests.
- Pick Uptime Kuma if you want click-to-monitoring today and a public status page for clients.
- Running both is a legitimate end state: Gatus for internal deep checks, Kuma for the public page.
If you have used either tool before, nothing in that table should shock you. Uptime Kuma won the adoption race because clicking “New Monitor” is a 30-second job and the status pages look client-ready out of the box. Gatus won the git crowd because the entire monitoring config is one reviewable file. The r/selfhosted threads that argue this (“gatus vs uptime kuma reddit” gets you there) boil down to workflow, not quality.
One cost note up front: both are free with no required paid tier. Kuma is donation-funded, Gatus has an optional managed offering you can ignore. The whole bill is a slice of a $4-6/month VPS and some disk. Which slice you want to own is the rest of this article.
Two philosophies: a web UI vs YAML in git
Kuma is UI-first. You click monitors into existence, they live in SQLite, and the dashboard streams live updates over WebSocket. Backup means copying the data/ directory. Your monitoring config is not diffable and not reviewable, and if that database file corrupts with no backup, you rebuild every monitor by hand.
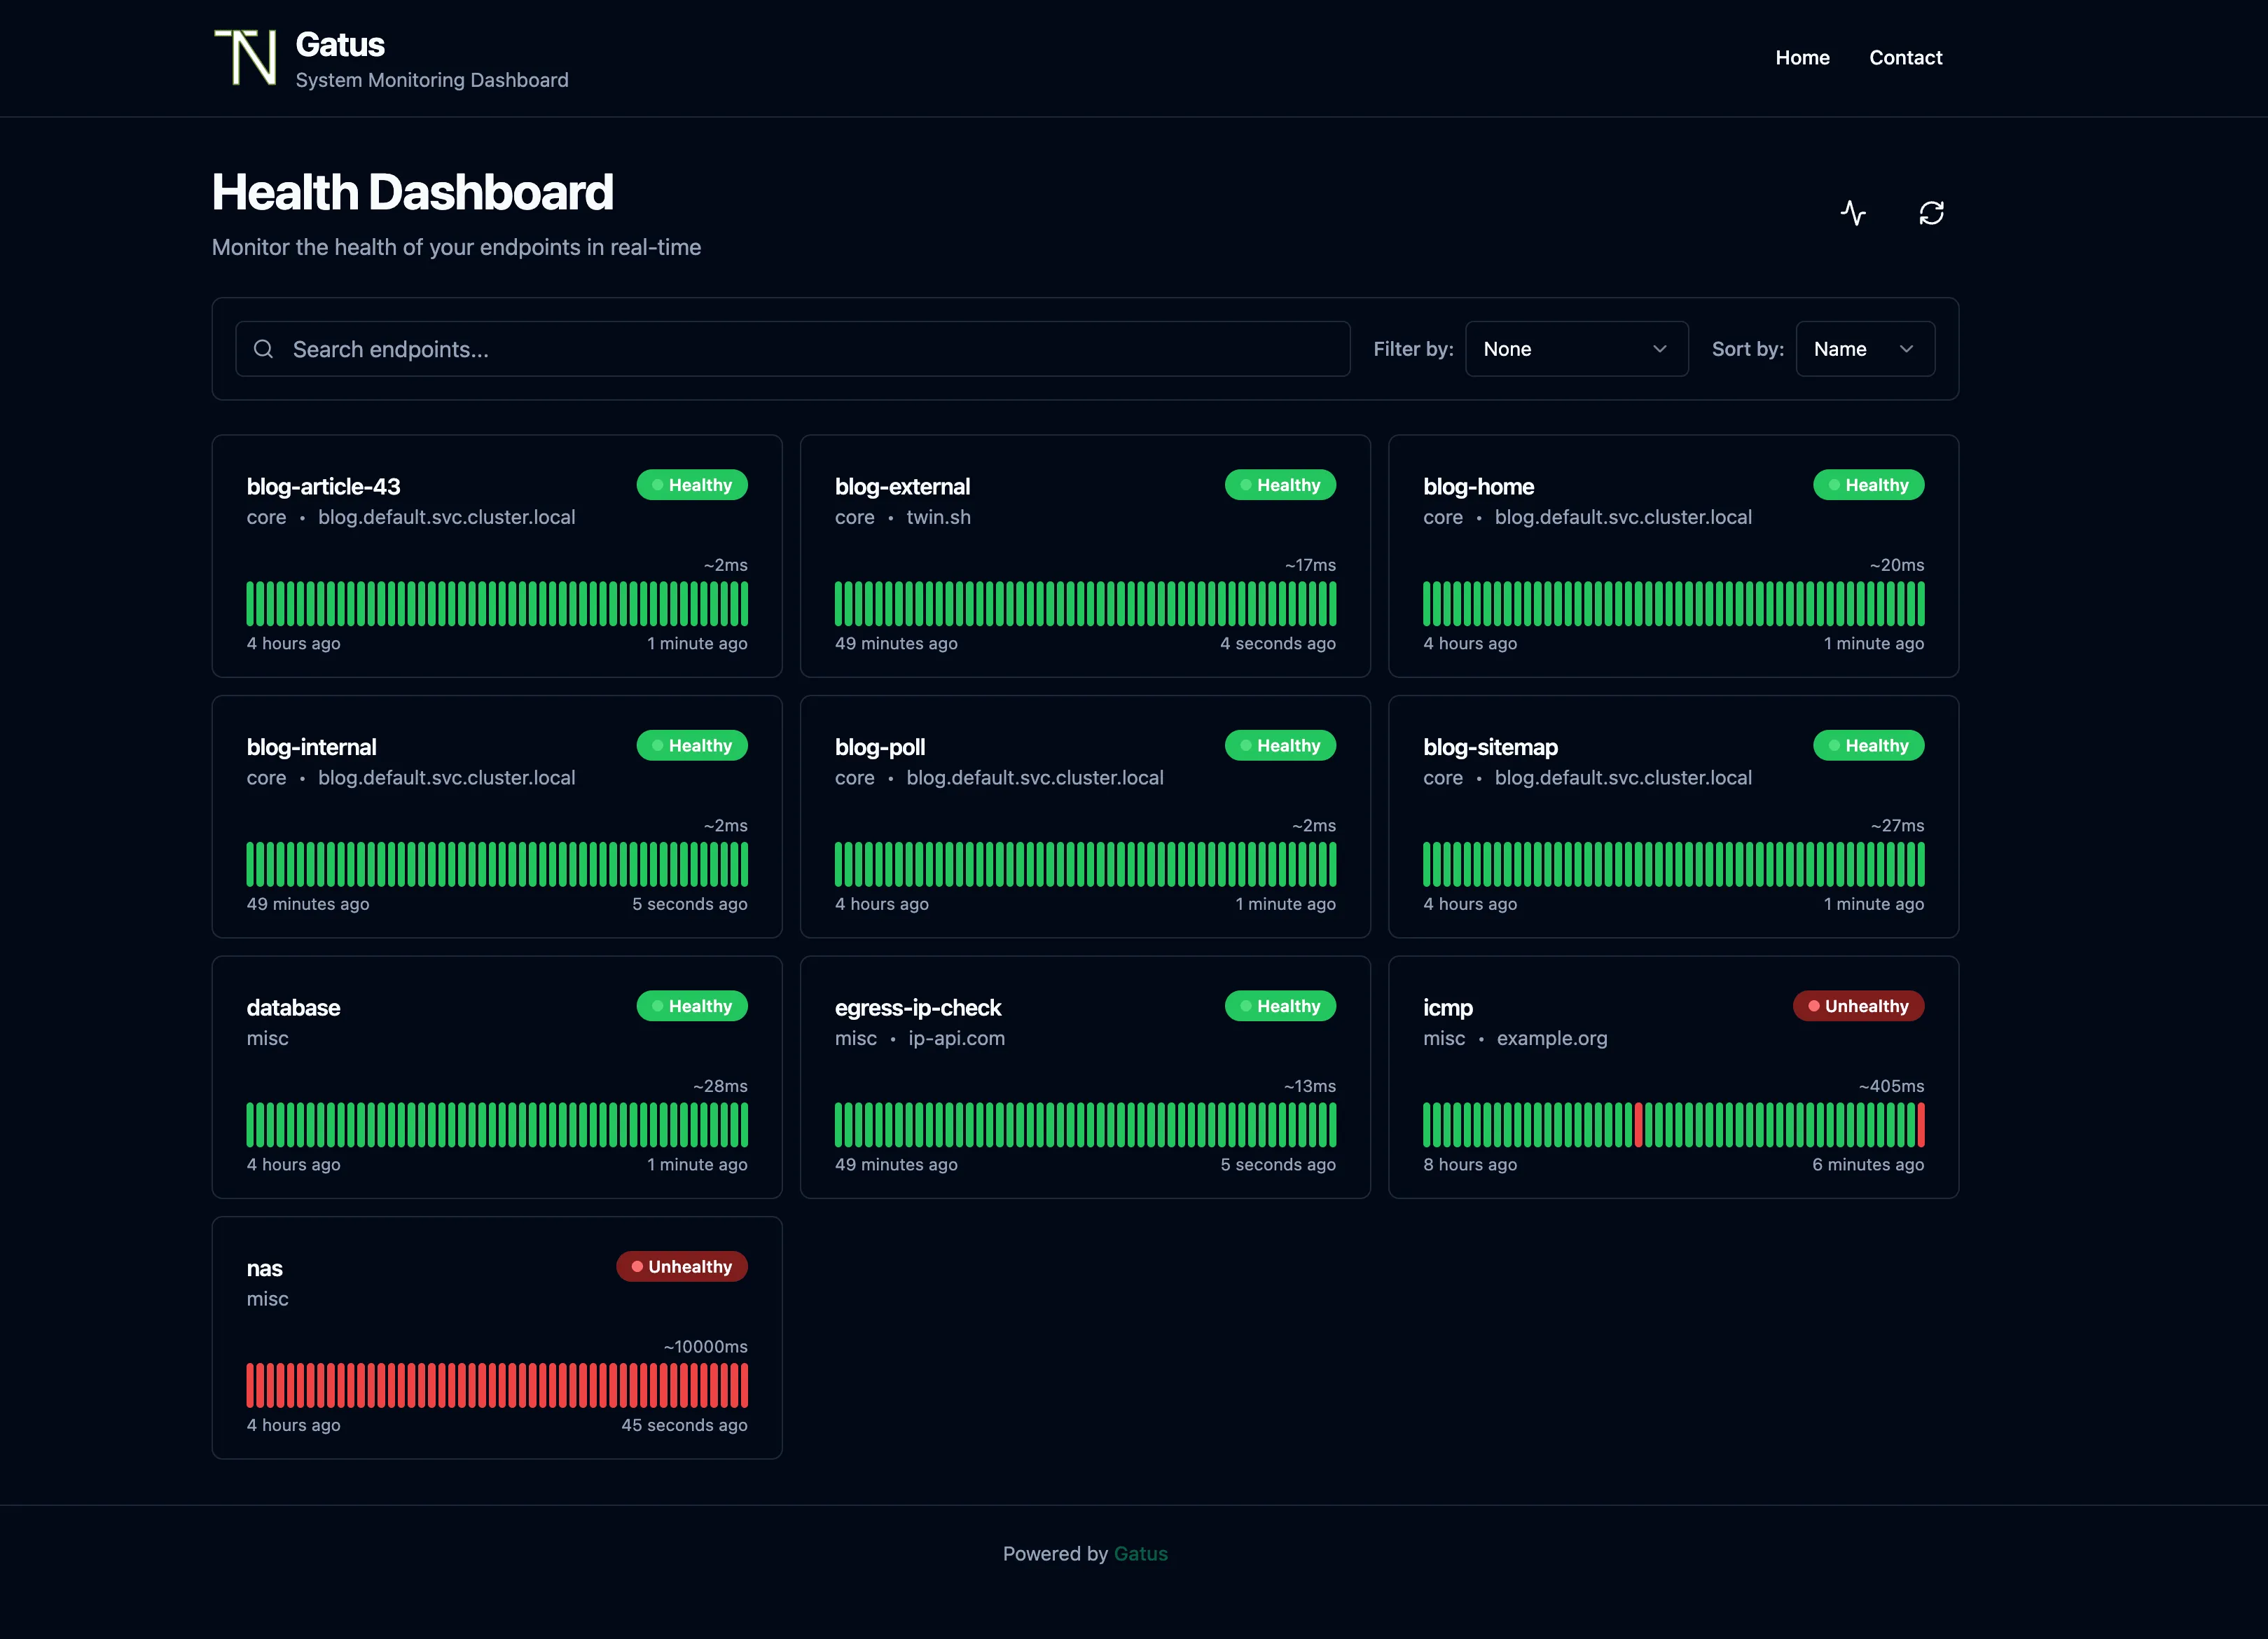
Gatus is config-as-code. The entire monitoring setup is one config.yaml (the gatus yaml config you commit), hot-reloaded when it changes. Review monitor changes in pull requests, revert them with git revert, and restore the whole thing onto a fresh box with git clone. Results go to SQLite or Postgres; the dashboard is read-only. It looked weak next to Kuma for years, but a UI refresh in the v5 line closed most of that gap, and users on r/selfhosted rate the current dashboard well.
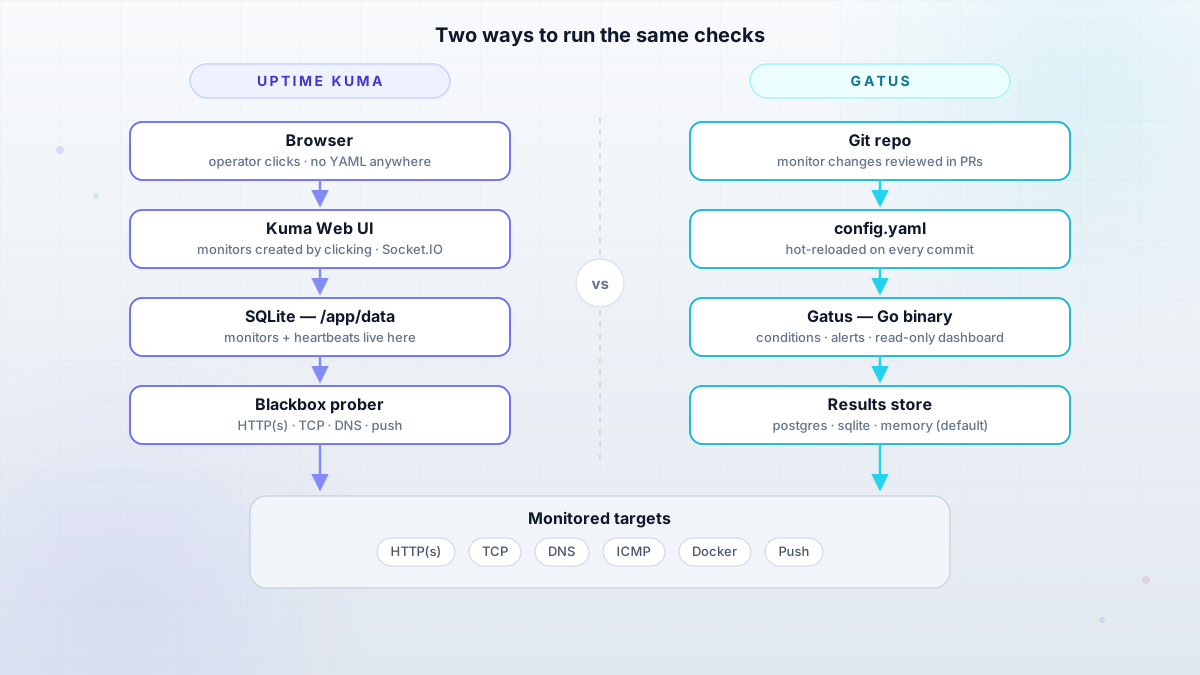
This is a workflow choice, not a quality choice
The 91k vs 12k star gap reflects how many people want click-ops monitoring, not which tool fits a git-managed VPS. If you are already self-hosting Git and CI/CD with Forgejo and Woodpecker, Gatus config changes land as reviewed commits in the same workflow as your app code.
Both are blackbox probers. They check from the outside whether a URL answers, a port connects, a cert is valid. That is a different job from node metrics or traces, which is why both are closer to UptimeRobot than to a Prometheus node exporter. Gatus’s README makes this case explicitly: metrics pipelines go quiet when no traffic reaches an app, while a blackbox check keeps probing.
Installing Uptime Kuma v2 with Docker Compose
Before you start:
- Docker and Docker Compose on a small Linux VPS (Debian 12 / Ubuntu 22.04+)
- A local volume path for the data directory (not NFS, see below)
- About 200 MB RAM headroom at homelab scale
- A reverse proxy with TLS later (Caddy, Traefik, or Nginx)
1 vCPU and 1 GB RAM is enough for either tool at this scale. Any cheap box works: a small Hetzner Cloud VPS, the box your Dokploy stack already lives on, a spare mini PC. No database container is required.
The README path pulls the compose file and starts the stack:
mkdir uptime-kuma && cd uptime-kuma
curl -o compose.yaml https://raw.githubusercontent.com/louislam/uptime-kuma/master/compose.yaml
docker compose up -d
# dashboard on http://localhost:3001 (first run creates the admin account)
If you prefer one command, and you want the port bound to localhost because a proxy will front it:
docker run -d --restart=always \
  -p 127.0.0.1:3001:3001 \
  -v uptime-kuma:/app/data \
  --name uptime-kuma louislam/uptime-kuma:2
Pin the :2 tag
The latest Docker tag is deprecated and stuck on the v1 line forever. Pin louislam/uptime-kuma:2 explicitly (see the deprecation discussion in issue #6338). If you wrote your compose file a while ago and it says image: louislam/uptime-kuma, fix it before the next pull.
NFS is not supported for the data volume
Kuma’s SQLite store on a network share will corrupt or fail writes. Local directory or Docker named volume only. NFS-mounted data dirs are the classic way people lose this database.
Verify the install:
docker compose ps        # or: docker ps --filter name=uptime-kuma
curl -I http://localhost:3001
You want HTTP/1.1 200 from curl (a 302 to the setup page on first run is also fine), then open the dashboard, create the admin account, and turn on 2FA (TOTP) while you are in there. A “container running but curl hangs” usually means the process is still migrating data. Check docker compose logs -f.
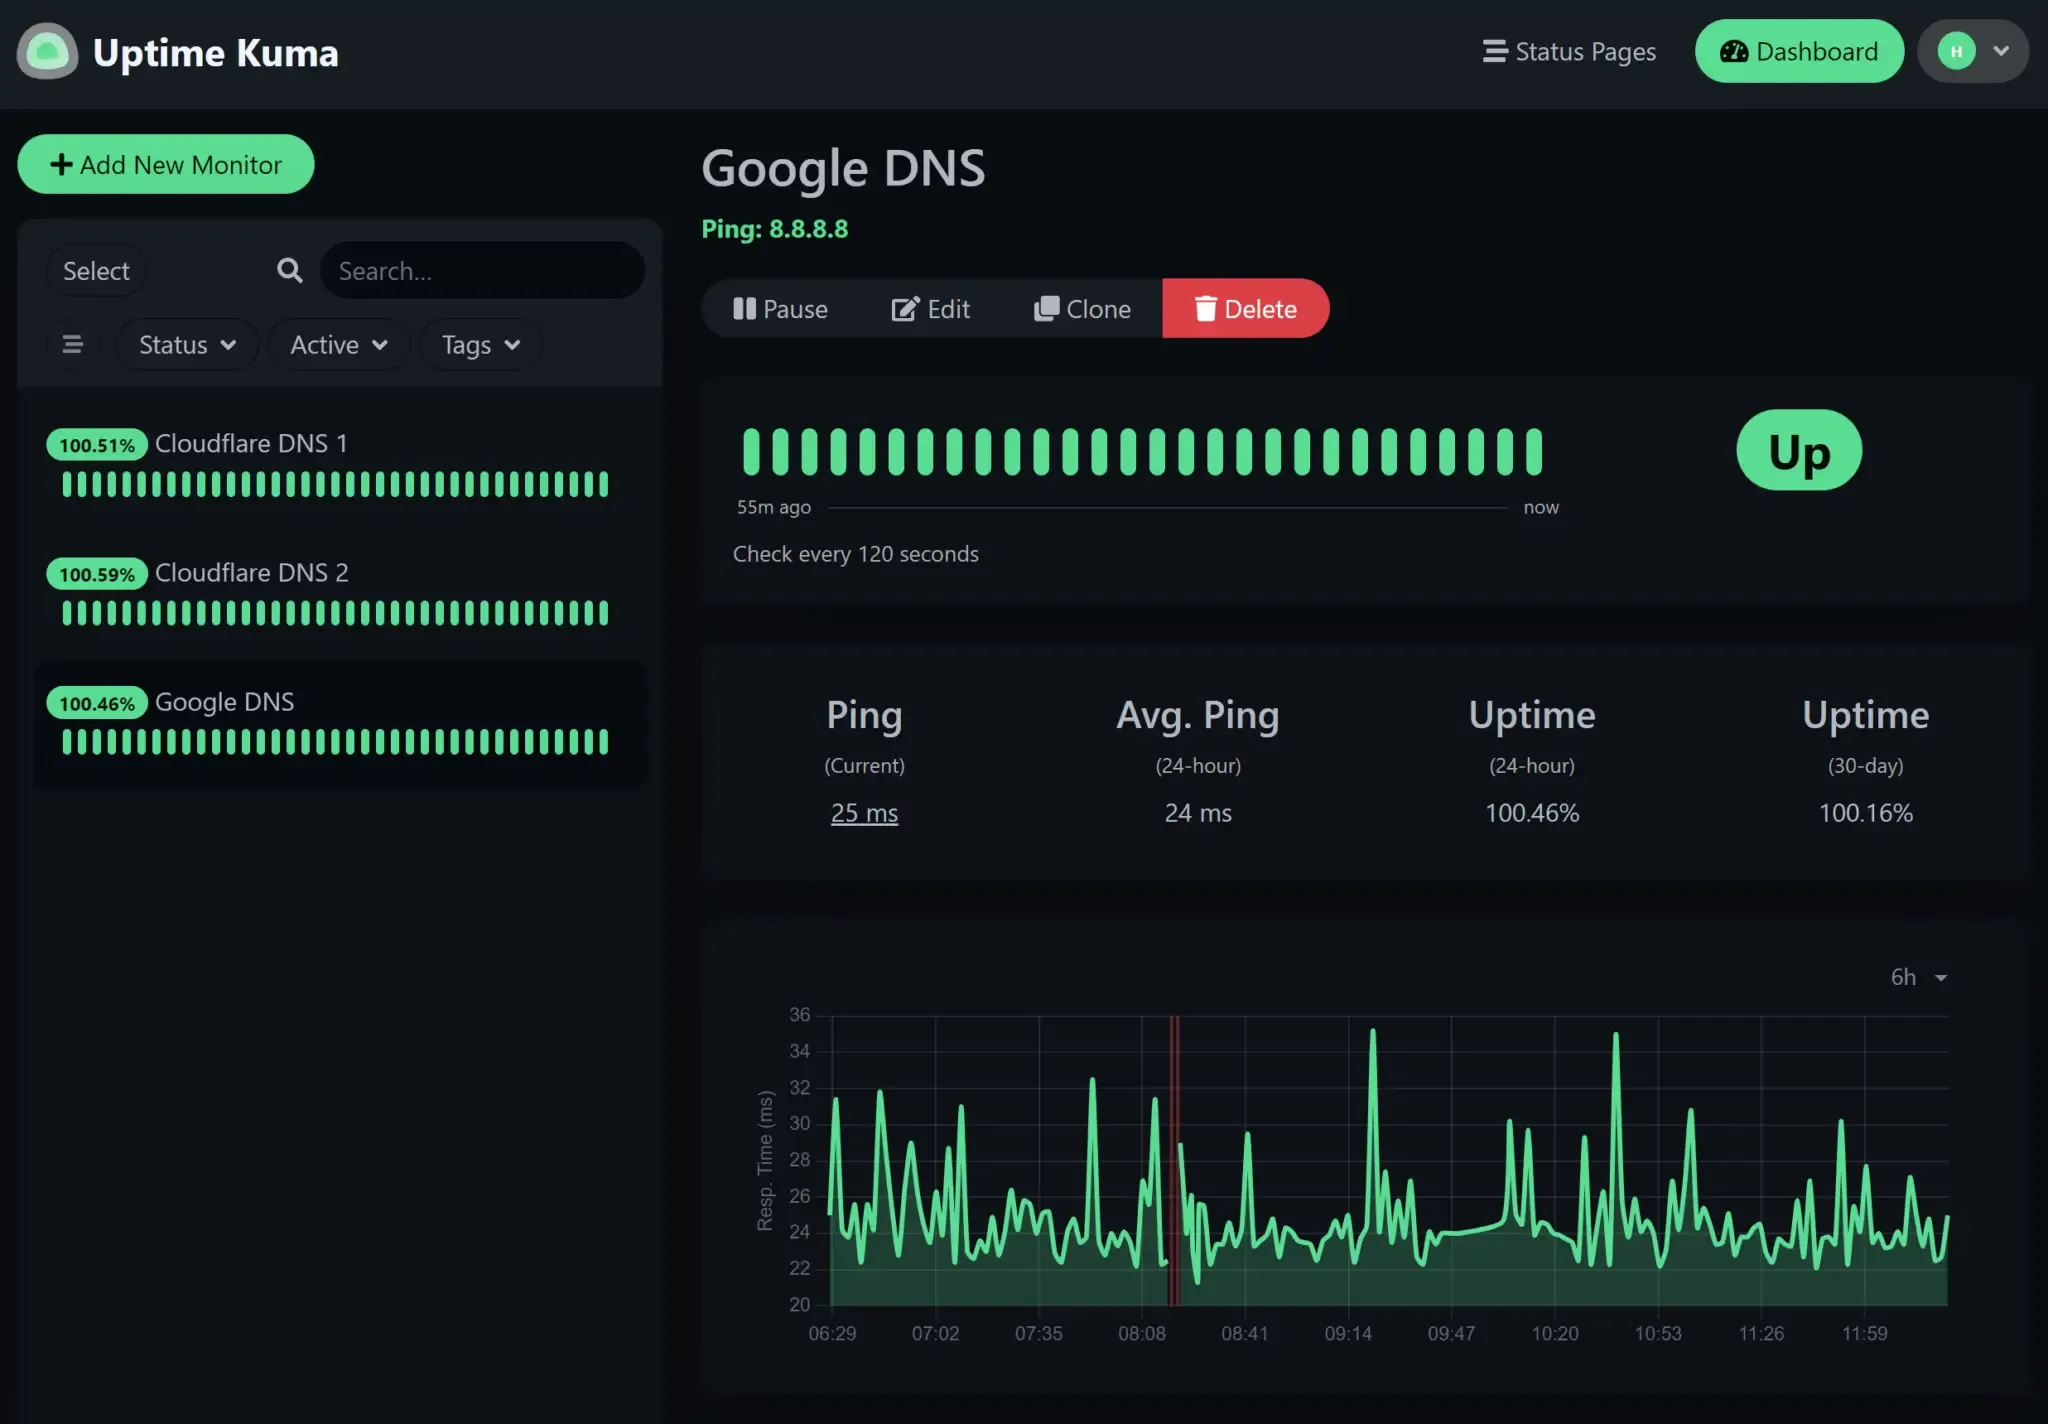
Upgrading from v1: the move to v2 is one-way and it rewrites the heartbeat table. If you have an existing instance, the Uptime Kuma v1 to v2 migration wiki is the source of truth. Short version:
docker compose down                  # 1. stop
cp -a /path/to/data /backup/data     # 2. back up the data dir (the wiki says: do it three times)
# 3. change the image tag to louislam/uptime-kuma:2
docker compose up -d
docker compose logs -f               # 4. watch the migration; do NOT interrupt it
Do not interrupt the migration
The wiki reports roughly 7 minutes for 20 monitors with 90 days of history, and warns it “can take hours” on slower hardware with more data. That timing is the maintainer’s figure, not a benchmark. If the migration is interrupted, restore the backup and retry. After it finishes, confirm old heartbeat history still shows on the dashboard.
Two more v2 traps worth knowing before you upgrade: Debian/Raspbian Buster hosts hit a libseccomp2 bug and must not be upgraded in place, and non-Docker installs now need Node.js 20.4 or newer. Rootless images exist, but the wiki does not recommend using them for a v1 to v2 upgrade.
Installing Gatus with Docker Compose
The Gatus install is one container and one YAML file. The two launch methods differ only in who manages the process.
Docker run
mkdir gatus && cd gatus && mkdir config data
$EDITOR config/config.yaml    # paste the config below
docker run -d --name gatus --restart=always \
  -p 127.0.0.1:8080:8080 \
  --mount type=bind,source="$(pwd)"/config,target=/config \
  --mount type=bind,source="$(pwd)"/data,target=/data \
  ghcr.io/twin/gatus:stable
Docker Compose
services:
  gatus:
    image: ghcr.io/twin/gatus:stable
    restart: always
    ports:
      - "127.0.0.1:8080:8080"
    volumes:
      - ./config:/config
      - ./data:/data
    environment:
- GATUS_CONFIG_PATH=/config/config.yamldocker compose up -dThe config file is where Gatus lives. This trimmed config/config.yaml covers storage, alerting, and two endpoints:
storage:
  type: sqlite
  path: /data/data.db      # default is memory; history gone on restart

alerting:
  telegram:
    token: "123456:ABC-DEF..."
    id: "0123456789"
    default-alert:
      failure-threshold: 3
      send-on-resolved: true

endpoints:
  - name: bitdoze
    group: public
    url: "https://bitdoze.com"
    interval: 60s
    conditions:
      - "[STATUS] == 200"
      - "[RESPONSE_TIME] < 800"
      - "[CERTIFICATE_EXPIRATION] > 336h"   # fail the check at under 14 days left

  - name: postgres
    url: "tcp://db.internal:5432"
    conditions:
      - "[CONNECTED] == true"
Default storage is memory
Out of the box, Gatus keeps results in RAM. A restart wipes history and alert state. Set storage.type: sqlite with a path on a mounted volume (or postgres) before you trust it with anything.
Bind-mount the config directory, not the file
Mount ./config at /config, not ./config/config.yaml at /config/config.yaml. Single-file bind mounts do not reliably propagate inotify events, so hot reload can miss your edits entirely (tracked in issue #151). The directory mount is the reliable setup.
Hot reload can kill the container
Gatus reloads config.yaml on change and, by default, exits on an invalid update. There is a skip-invalid-config-update option, but the author recommends leaving it false so a broken config fails loudly. Watch docker compose logs after every edit either way.
A few config details that save debugging time: ${ENV_VAR} substitution works in the YAML (escape a literal dollar sign as $$, which bites when you paste webhook URLs with $ in them), GATUS_CONFIG_PATH points at a non-default config file, YAML anchors work for shared defaults, and [DOMAIN_EXPIRATION] checks refuse intervals tighter than 5 minutes to stay clear of WHOIS rate limits.
Verify the install:
docker compose ps
curl -I http://localhost:8080
Open the dashboard and confirm both endpoints from the config are listed and green. Then edit config/config.yaml (add a comment) and check docker compose logs for a reload message. That round trip proves hot reload is actually watching the directory.
Sizing aside: the same 1 vCPU / 1 GB VPS runs this comfortably, and if you are shopping for a second box to keep monitoring separate from production, a budget Hostinger VPS does the job. ICMP checks inside containers needed CAP_NET_RAW on Gatus versions before v5.31.0; since v5.31.0 unprivileged ping works unless you run the container as root.
Putting both behind a reverse proxy
The deployment shape on this stack is boring on purpose: Docker on the VPS, Caddy or Traefik or Nginx in front with TLS, and both tools bound to 127.0.0.1 in compose so nothing answers on the public interface. Do not publish 3001 or 8080 to the internet and call it done; both dashboards deserve auth plus TLS plus a firewall.
Do not expose 3001 or 8080 publicly
Bind to localhost in compose and let the proxy own the hostname. Then audit what the box actually exposes. That audit habit is the point of hardening a Docker server with ufw: Docker writes its own iptables rules, and a stray published port walks straight past ufw. If you need the dashboard reachable without open ports at all, a self-hosted Cloudflare Tunnels alternative like Pangolin is the cleaner path.
Rollback is trivial. Change the port mapping back to 8080:8080, restart, and curl http://localhost:8080 works again. Nothing inside either tool knows or cares about the proxy.
Uptime Kuma needs WebSocket support
The live UI rides a long-lived Socket.IO WebSocket. Proxies that cut idle connections make the dashboard look frozen: the page loads, then nothing updates. Set read timeouts to 3600 seconds or more on the proxy route (the reference Nginx and Traefik configs for Kuma both do this), and make sure the proxy forwards Upgrade and Connection headers.
Classic symptom
Dashboard loads fine but heartbeats never tick in real time through the proxy, while curl against localhost shows data. The proxy is killing the WebSocket. Fix the upgrade headers and the read timeout before blaming Kuma.
Verify: open the dashboard through the public hostname, trigger a test check, and watch the heartbeat bar move without a page reload.
Gatus needs its own subdomain
Gatus does not support path-based routing. status.example.org works; example.org/status/ does not (see the FAQ in the Gatus README and issue #88). Plain HTTP proxying is enough, no WebSocket requirement.
Subpath installs will 404
If you mounted Gatus at /status/ and get 404s on assets or the API, that is expected. Move it to a subdomain. Do not waste an evening on rewrite rules; the tool does not generate subpath-aware URLs.
Verify: browse to the subdomain and see the dashboard with live-check results. That is the whole test.
The same five monitors, configured twice
Feature matrices lie by omission. Here is one realistic solo-operator stack configured in both tools so you can compare the experience: a public site, an API with a JSON health endpoint, Postgres on an internal hostname, a TLS cert you care about, and a nightly backup job stuck behind a firewall. Same five monitors, two philosophies.
HTTP checks with keyword and JSON body conditions
Uptime Kuma
Click New Monitor and pick the type:
- HTTP(s) - Keyword: URL
https://bitdoze.com, keywordbitdoze(or any string that must appear in the body). Interval 60 seconds (the floor is 20 seconds). Set “Max. response time” to reject slow pages. - HTTP(s) - JSON Query: URL
https://api.example.com/health, JSON query$.status, expected valueok. This is how you assert on a JSON field instead of scraping text.
Pick the notification channel on the same screen and save. The monitor starts probing immediately. Remember that monitors created on v2 default to retries: 0, so a single failed check can flip status; set retries to 2-3 on anything flappy.
Gatus
endpoints:
  - name: bitdoze
    group: public
    url: "https://bitdoze.com"
    interval: 60s
    conditions:
      - "[STATUS] == 200"
      - "[RESPONSE_TIME] < 800"

  - name: api-health
    group: public
    url: "https://api.example.com/health"
    interval: 60s
    conditions:
      - "[STATUS] == 200"
      - "[BODY].status == ok"
      - "len([BODY].dependencies) > 0"
Conditions are the whole point: every line must be true or the check fails. The language covers [STATUS], [BODY] (JSONPath), [RESPONSE_TIME], plus helpers like len(), has(), pat() and any() for pattern and emptiness checks.
Response-time assertions map to Kuma’s “Max. response time” field versus Gatus’s [RESPONSE_TIME] < 800 condition line. Same intent, different surface.
TCP port checks
Uptime Kuma
Add a monitor of type TCP Port. Host db.internal, port 5432, interval 60 seconds. Done. If Kuma runs in Docker and the database is another compose service, the hostname has to resolve inside the container (same compose network, or an extra_hosts entry).
Gatus
  - name: postgres
    group: internal
    url: "tcp://db.internal:5432"
    conditions:
      - "[CONNECTED] == true"
You can add "[RESPONSE_TIME] < 500" if a slow handshake matters. Gatus also does UDP and SCTP, which Kuma does not.
The gotcha is identical in both tools: container DNS. “Connection refused” from inside a container almost always means the hostname does not resolve there, not that Postgres is down.
TLS certificate expiry alerts
Uptime Kuma
On any HTTPS monitor, enable Certificate Expiry Notification. Kuma watches the cert and notifies you before it expires. The threshold is a per-monitor setting, separate from the up/down check.
Gatus
  - name: bitdoze
    url: "https://bitdoze.com"
    conditions:
      - "[STATUS] == 200"
      - "[CERTIFICATE_EXPIRATION] > 336h"   # 14 days
This fails the check when fewer than 14 days remain, so the normal failure-threshold alerting fires. It is an assertion, not a side channel.
Verify without waiting for a real cert to rot: set the Gatus threshold to something huge like 8760h (a year) against any normal certificate and watch the endpoint go red, then set it back.
Push monitors and dead man’s switches
The use case: a nightly backup behind NAT that cannot accept inbound checks. You want an alert when the job does not report in.
Uptime Kuma
Create a monitor of type Push. Kuma gives you a push URL. Have the job call it at the end of a successful run:
curl "https://status.example.com/api/push/PUSH_TOKEN?status=up&msg=backup+finished"No push within the monitor’s grace window and Kuma flips it down and notifies. This is a proper dead-man switch.
Gatus
external-endpoints:
  - name: nightly-backup
    group: internal
    token: "CHANGE_ME_LONG_RANDOM_STRING"   # openssl rand -hex 32
    alerts:
      - type: telegram
        send-on-resolved: true
        failure-threshold: 3
The job pushes a status with the token as a bearer header. The key in the URL is group_name, with spaces and punctuation replaced by dashes:
curl -X POST \
  -H "Authorization: Bearer CHANGE_ME_LONG_RANDOM_STRING" \
  "https://status.example.org/api/v1/endpoints/internal_nightly-backup/external?success=true"
Add &success=false&error=exit+1 on failure. Heartbeat watchdog is optional: if no push arrives within the configured interval, the endpoint goes unhealthy and your alerts fire.
Other comparisons get this wrong
You will read that Gatus has no push mode. It does. external-endpoints with a bearer token is exactly that escape hatch, and it is documented in the Gatus push-based monitoring docs. Both tools are pull-first with a push option, so do not pick on this axis.
Alerting: thresholds, notifications, and maintenance windows
An alert nobody trusts is noise. Both tools let you dampen properly, but they express it differently.
Uptime Kuma ships 90+ notification providers (Telegram, Discord, Gotify, Slack, Pushover, ntfy, SMTP, and on). Per-monitor retries control how many failed checks pass before a notification. Note the v2 behavior change: new monitors default to retries: 0. Set 2-3 on anything flappy or you will hate the bot within a week. The certificate-expiry toggle rides the same notification channel.
Gatus ships about 40 provider types (Slack, PagerDuty, Opsgenie, Teams Workflows, Telegram, Discord, ntfy, Gotify, n8n, GitHub and Gitea issues, custom webhooks with placeholders) and pushes threshold logic into the config: failure-threshold, success-threshold, send-on-resolved, and minimum-reminder-interval for the “still down, hourly nag” case. Those live per endpoint or in default-alert.
Maintenance differs too. Gatus has maintenance windows with timezone and weekdays, plus per-endpoint maintenance-windows for that one service you restart every Sunday. Kuma has per-monitor pause and a maintenance concept you set from the UI.
Gatus silently ignores misconfigured providers
If an alerting provider is not properly configured, every alert of that provider type is ignored. No error, no notification, no hint until you needed it. Fire a real test alert after every alerting change. This is the failure mode that makes people think “Gatus is broken” when Gatus is fine and the token is wrong.
Kuma v2 changed email templates
SMTP notification templates moved to LiquidJS in v2 and the template variables are now case-sensitive. If your email alerts look empty after upgrading, check the variable casing in the template.
Alerting test protocol (run this once per tool, then after every alerting change):
- Stop the target service. Confirm the alert fires after the configured threshold, not on the first blip.
- Start the service again. Confirm the resolved notification arrives (
send-on-resolvedin Gatus, Kuma’s recovery message). - Restart the monitoring container. Confirm config and history survive. This is where Gatus memory storage and Kuma volume mistakes show up.
- Restore the backup into a fresh container once. An unrestored backup is a hope, not a plan.
docker compose logs in both projects shows alert dispatch attempts. If a test alert does not arrive, the logs are the first place to look.
Self-hosted status pages: one dashboard vs many
This is where the tools stop looking alike. A self-hosted status page is the thing your clients look at during an outage, and the two products solve it differently.
Uptime Kuma supports multiple public status pages, each with its own monitor selection, and each mappable to its own domain. That is the feature that pulls client-facing users toward Kuma. Combine it with per-page branding and you have something you can put in front of a customer.
Gatus renders one dashboard/status page per instance. It supports announcements and incident messages, but if you want “one page showing three regions”, the multi-instance aggregation (“remote instances”) is explicitly experimental with known issues (issue #64). Do not build a client commitment on it yet.
Auth follows the same split. Kuma has user accounts with TOTP 2FA for operators. Gatus has basic auth (bcrypt-hashed, cost 9 recommended) and OIDC, but no 2FA of its own, so the OIDC provider has to carry that.
Client-facing
Use Uptime Kuma. Build a status page per client (or per product), attach a custom domain, and leave the admin dashboard on a different hostname with 2FA on. Kuma is the tool picked when non-technical stakeholders read the page.
Internal team
Use Gatus behind your SSO. Point OIDC at your identity provider, bind it to an internal hostname, and keep the whole thing off the public internet. The condition language gives your team deeper checks than a keyword match, and nobody outside the org needs the URL.
Remote instances are experimental
Gatus can aggregate remote instances into one view, but the feature ships with known issues and an explicit warning upstream. Fine for a homelab curiosity, not for a status page you promise customers.
Storage, backups, and what breaks six months in
Backups you have not restored are hopes
The monitor that cannot be restored is a second outage. Do one restore drill for whichever tool you pick, in a scratch directory, this week. Every comparison of these two tools that skips restore speed is missing the point.
Six months in, the differences are operational, not functional. Disk grows and the VPS gets rebuilt after a botched upgrade. A config typo takes a dashboard down at midnight. What matters then: how fast you are back in business, and whether anything is left to rebuild by hand.
Uptime Kuma: SQLite growth, the v1 to v2 migration, and backup discipline
Heartbeat history makes Kuma’s SQLite file grow without bound. Users on r/selfhosted report files of several hundred MB and a sluggish monitor list on old instances. The v2 release aggregates heartbeats into a denser format specifically to address this, but do not take “v2 fixed it” on faith until your own instance has months of data on it.
The v1 to v2 migration exists because of that format change. It is one-way, it rewrites the heartbeat table, and the maintainer’s own figure is about 7 minutes for 20 monitors over 90 days, with a warning that it can take hours on slower hardware. Interrupt it and you restore from backup.
Backing up Kuma is file-level: the data/ directory (mounted at /app/data in the container). v2 removed the old JSON backup/restore path, so a data-dir copy is the only supported method. Keep it in your nightly job alongside the rest of the box, for example with self-hosted backups with Restic and Rclone. An offsite target can be anything S3-shaped; some people go as far as mounting an S3 bucket as a filesystem on a VPS for archive copies.
Backup the data dir, never mount it remotely
JSON export was removed in v2, so /app/data is your only lifeline. Copy it to offsite storage; do not run Kuma on top of a network or FUSE mount. NFS is unsupported, and a slow network mount as the live data dir will corrupt SQLite the same way.
Restore is stop, copy, start. The failure mode that hurts: a corrupted SQLite file with no backup means clicking every monitor back into existence, because there is no declarative export to reload.
Gatus: the memory-storage footgun and the GitOps restore story
With the default memory storage, a routine docker compose restart silently erases your uptime history and alert state. That is worth stating plainly because it bites people. Set storage.type: sqlite (or postgres) on day one and mount a volume at /data.
Once that is done, Gatus has the best restore story in this category. The config is in git, so a VPS rebuild is git clone and docker compose up -d. History is a sqlite file you can take or leave (a pg_dump if you chose Postgres). Your monitoring config backup is literally git push.
One tuning knob matters at scale: concurrency defaults to 3 simultaneous endpoint evaluations (a deliberate semaphore so response-time measurements stay accurate). With many endpoints and the default 10-second timeout, slow checks serialize and skew intervals. Raise concurrency deliberately, lengthen timeouts on the slow endpoints, or split heavy checks onto a second instance. concurrency: 0 disables the limit (it replaces the deprecated disable-monitoring-lock).
Closest thing to HA in this comparison
Multiple Gatus replicas on Postgres is the only multi-instance story here, and it is the reason to consider Postgres at all. Kuma is single-node by design. For a solo VPS, SQLite everywhere is the boring correct answer.
Resource usage on a small VPS
Neither tool needs a database container at solo scale, and neither justifies a bigger VPS. Skip Postgres for Gatus unless you want replicas or very large history; skip an external database for Kuma until SQLite genuinely hurts.
Order-of-magnitude RAM figures from third-party writeups: Gatus (a Go binary) around 20-50 MB idle, Kuma (Node.js) around 100-256 MB. Treat those as ballpark, not measurements. Run your own:
docker stats --no-streamThat prints actual usage for whatever is on this box. Do it before and after adding a few dozen endpoints so you are not arguing with a blog post when the monitor is the thing on the table. If the whole VPS feels slow, benchmark your VPS with YABS first and separate disk/network problems from monitor problems.
Sizing: 1 vCPU / 1 GB RAM runs either tool comfortably under 100 endpoints. What grows is disk, and only for heartbeat history. After the 2026 VPS price increases, this is still a rounding error next to the VPS bill itself. A Hetzner Cloud CX-class VPS is the usual pick for this kind of always-on box.
Keep it single-container
Resist the compose-file-with-Postgres-Redis-and-a-cache reflex. One container plus one volume is two things to back up and two things to break. Add a database only when a concrete requirement (replicas, huge history) shows up in writing.
Hardening nod: set mem_limit (compose v2 syntax, or deploy.resources under Swarm) on both containers so a runaway heartbeat table or a stuck probe cannot eat the box, and keep the images pinned (:2, :stable) so upgrades happen when you decide, not when a tag moves.
Verdict: which self-hosted uptime monitoring tool should you run?
For a solo operator with a handful of side projects, either tool works. Pick by workflow, because that is what you will maintain at month six.
Choose Gatus if:
- Your infra lives in git, Ansible, or compose repos and monitor changes belong in pull requests.
- You want condition depth: JSONPath, cert and domain expiry, DNS rcode, SSH command checks.
- RAM is tight and you want a static Go binary in the tens of MB.
- Restore speed after a rebuild matters more than a pretty public page (git clone and done).
- You might run replicas on Postgres one day.
Choose Uptime Kuma if:
- You want monitoring today, configured by clicking, with no YAML appetite.
- A public, client-facing status page is part of the job, and you may need several on different domains.
- 2FA on the dashboard and 90+ notification providers out of the box matter.
- Your workflow is a browser, not a git commit, and you are fine with backing up one data directory.
And yes, running both is legitimate. Gatus for internal and deep checks (ports, JSON contracts, cert expiry, push heartbeats from cron), Kuma for the public status page and the pretty heartbeats. Two single-container tools on one box is still less moving parts than most “all-in-one” observability stacks.
On the “91k stars means Kuma wins” objection: adoption counts the click-ops majority. It does not know whether your infrastructure lives in git. If it does, the YAML tool is the one you will still be happy with when the dashboard is not open.
Total cost of either path: under 300 MB RAM combined, a slice of a $5 VPS, and the 20 minutes to install plus the backup routine you were going to set up anyway.
See how this fits a Dokploy / Traefik stackWhen neither fits: Prometheus Blackbox Exporter
If you already run Prometheus and Grafana and you want probing to feed dashboards and Alertmanager rules rather than a dedicated status page, the Prometheus Blackbox Exporter is the right-shaped tool. You get probed targets as scrape metrics, and you assemble alerting and status display yourself. That assembly is exactly the work Kuma and Gatus do for you, so pick the exporter only when you are already living in that ecosystem.
Uptime monitoring is not observability
Knowing “the site is down” is one job. Knowing why (traces, metrics, logs) is another. If you need the second job, look at Traceway, a self-hosted Datadog alternative, and keep the uptime tool anyway: they complement each other.
For everyone else, the two tools in this article are simpler to install and restore, and they ship a status page without a PromQL detour.
Uptime Kuma vs Gatus FAQ
Is Gatus better than Uptime Kuma?
Better at what? Gatus is better when your monitoring config should live in git and when you need condition-level assertions over JSON bodies, certificates, or DNS responses. Uptime Kuma is better when you want the fastest path to monitoring and a multi-page public status page. Neither is “better” in the abstract. Pick by workflow, which is the whole argument of this article.
Does Gatus have a web UI?
Yes. Gatus renders a dashboard showing every endpoint, uptime bars, response times, and status-page features like announcements. It is read-only for configuration (the YAML is the source of truth), and the visual refresh in the v5 line fixed most of the “ugly next to Kuma” complaints that used to show up on r/selfhosted.
Why is my Uptime Kuma slow or the SQLite file huge?
Heartbeat history accumulates and the SQLite file grows with it. r/selfhosted threads report files of several hundred MB and lag in the monitor list on older instances. Kuma v2 aggregates heartbeats into a denser format aimed at this, so upgrading to louislam/uptime-kuma:2 is the first move, then watch your own instance over weeks rather than trusting any blog. Keep the data dir backed up, and never put it on NFS.
Can Gatus send push-based heartbeats?
Yes. external-endpoints in config.yaml defines an endpoint that Gatus does not probe; instead your job pushes a status via POST /api/v1/endpoints/{group}_{name}/external with a bearer token, optionally with success, error and duration parameters. An optional heartbeat watchdog marks the endpoint unhealthy if pushes stop arriving, which makes it a proper dead-man switch for cron jobs behind a firewall. Some comparisons claim Gatus has no push mode; the upstream docs say otherwise.
Does Uptime Kuma v2 change how I back up?
Yes. v2 removed JSON backup/restore, so copying the data/ directory is the only supported method. The v1 to v2 migration is one-way and rewrites the heartbeat table, so take a full copy of the data directory first (the migration wiki suggests doing it three times) and do not interrupt the migration once it starts. Restore is stop container, replace directory, start container.
Can I run Uptime Kuma and Gatus together?
Yes, and plenty of operators do. Typical split: Gatus owns internal and deep checks (TCP ports, JSON health contracts, certificate expiry, push heartbeats from batch jobs) while Kuma owns the public status page with its heartbeats and custom domains. Both are single containers, both run on the same $5 VPS, and they do not step on each other’s ports or storage.